Candlestick Patterns For Beginners
Candlestick patterns are used to predict the future direction of price movement for forex trading.What is Candlestick?
Candlestick is one of the most popular components of technical analysis that displays information about currency pairs at a particular time like opening, high, low, and closing prices.
Many types of candlestick patterns are widely used in forex trading in the world market. some provide insight into the balance between buying and selling pressure, while others identify continuation patterns or market indecision like doji candles.
Before starting the trading journey, it's important to understand the basics of candlestick patterns for forex trading and how they will help you while doing forex trading.
Bullish And Bearish Candles
Each candle shows specific information in at specific timeframe. The candle should be bullish or bearish depending on the direction of price.
Bullish Candle is a candle that is formed at a specific level and closes at a higher level(than the opening price).
It shows the price is increasing. Bullish candles are green/white in color.
Bearish Candle is a candle that is formed at a specific level and closes at a lower level(than the opening price).
It shows the price is dropping. And it is Red/Black in color.
Bullish vs Bearish Candle
Try to understand the differences in between the two candles. And make your forex trading journey successful.
How to read Chart with the help of Candlesticks for Forex Trading?
Chart or Candle Charts are technical tools that show the price movement of stocks, currencies, cryptocurrency, and commodity markets.
- There are various ways to use and read candlestick charts. Candlesticks chart analysis depends upon your trading strategy and timeframe.
- The candlestick represents information about the price action. For example, a red candle or black candlestick means the bears are dominating at the specified time. A green candle or white candlestick means that the bulls control the market.
- There are also doji candles which are formed when the price is oversold/overbought zones, it is also called neutral candles where there will be high chances to reverse the trend.
When analyzing the candlestick chart, it is very important to set up the time frame to get better results.
- Timeframe ranges from 1Min to 1Month. Short-term traders are generally using 15m, 1h and 4h timeframe to see the good volatility in the market.
- The longer the timeframe, the more accurately you can predict the strength of the prevailing trends.
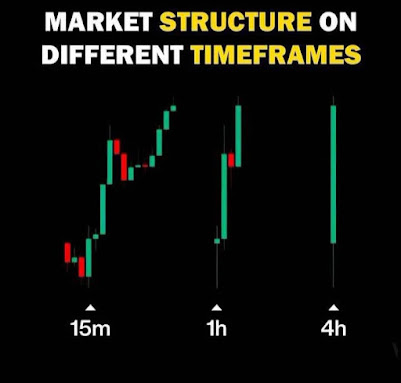
- The small timeframe is not that much applicable in forex trading because of candlesticks formed at a shorter timeframe are just a shadow of the longer timeframe candlesticks. let clear this concept with the help of examples:
This is a chart of EUR/USD.
Image 1:- it shows the 15min timeframe.
Image 2:- it shows the 1h timeframe.
Image 3:- it shows the 4h timeframe.
Now you can compare both images/timeframes to see the accurate timeframes to enter in any trade. Thus, a longer timeframe works more accurately compared to a shorter timeframe.
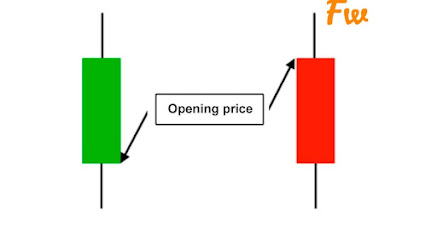
Open Price
Open Price is the price level from where the candles start to be formed. if the price increases, the candle will be green/white and if the price goes down, the candle will be red/black.
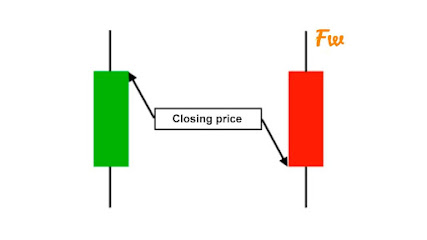
Close Price
The closing price is the final price of the candlestick formed over the period. if the price is higher than the opening price then the candle forms green and if the closing price is below the opening price then the candle forms red.
High Price
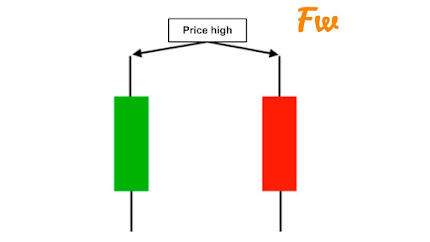
The high price is the highest price point of the candlestick. it is denoted by upper shadow, if there is no shadow then the closing price is high for the green candle and the opening price is high for the red candle.
Low Price
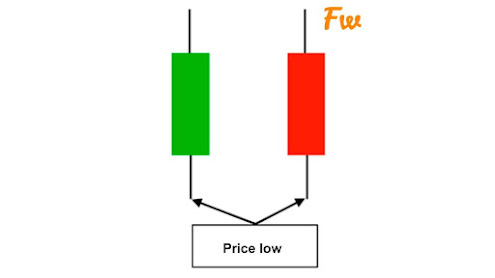
The low price is the lowest price point of the candlestick. it is denoted by lower shadow, if there is no shadow then the opening price is low for the green candle and the closing price is low for the red candle.
Wicks
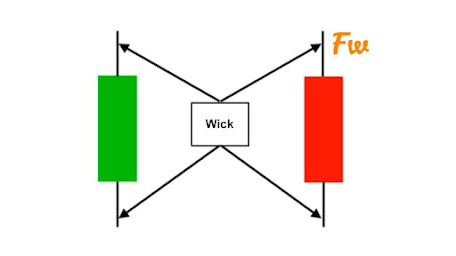
Wicks is also known as 'shadow'. It shows the high price and low price of the candlesticks. it is formed at the top and the bottom.
Direction
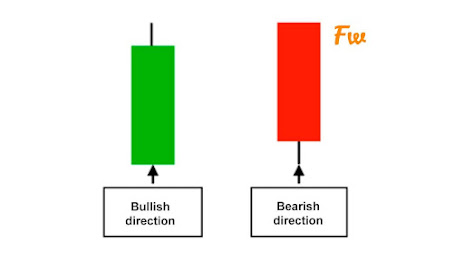
The price direction is the price movement denoted by the candle body. it the Green candle is forming it means the price is increasing upwards and if the Red candle is forming it means the price is increasing downward.
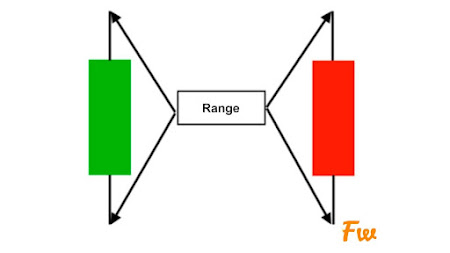
Range
The distance between high price and low price is called range.
Types of Candlestick Patterns
- Single Candlestick Patterns
- Double Candlestick Patterns
- Triple Candlestick Patterns
Single Candlestick Patterns
- Bullish Marobozu
- Bearish Marobozu
- Hammer
- Hanging Man
- Inverted Hammer
- Shooting Star
- Doji
Double Candlestick Patterns
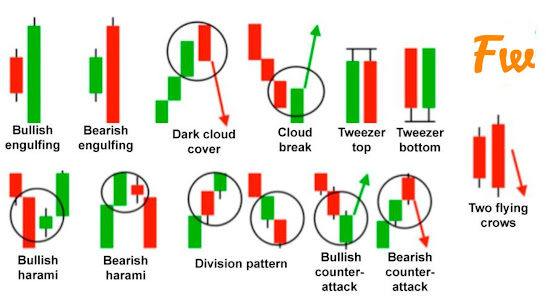
- Bullish Engulfing Pattern
- Bearish Engulfing Pattern
- Bullish Harami
- Bearish Harami
- Piercing
- Dark Cloud Cover
Triple Candlestick Patterns
- Morning Star
- Evening Star
- Three White Soldiers
- Three Black Crows
Advanced Candlesticks Analysis For Forex Trading
- Size of the candlestick body
- Length of the shadow
- Body-to-Shadow ratio
- Position of the candlestick body
Size of the candlestick body
- if the size of the candlestick bodies increases continuously then it indicates the momentum of the trend is increasing.
- During this period, never trade against the trend.
- if the size of the candlestick bodies decreases continuously then it indicates the momentum of the trend is decreasing.
- During this period, never trade against the trend, or better to wait for the reversal signs.
- if the candlestick bodies remain more or less constant then it indicates a steady trend.
Length of the Candlestick Body
- The upper shadow indicates selling pressure or rejection of the higher price.
- The lower shadow indicates buying pressure or rejection of the lower price.
Body-to-Shadow Ratio
- Candlestick bodies are formed longer than shadows during the trends.
- when the trend weakens, the shadows of candles start becoming bigger than candlestick bodies.
- In the case of Sideways movement or consolidation phase or when the trend is about to reverse, candlesticks have a a long shadow and short bodies.
Position of Candlestick Bodies
Note:- Never look only at one or more of the above-mentioned aspects of candlestick in isolation, use them together to get a complete picture of what is happening.
Conclusion
In conclusion, candlestick patterns are super helpful for beginners in trading. They show you what the market might do next and help you decide when to buy or sell.
Starting with basic patterns like doji, hammer, and engulfing patterns is smart. Then, start for the complex one.
But remember, don't depend only on candlestick patterns. It's important to mix them with other tools like technical indicators and risk management.
Using candlestick patterns as part of your trading plan can really boost your chances of making good decisions and succeeding in the trading world.
Tags:
FOREX TRADING

.jpg)
.jpg)
.jpg)
.jpg)


.jpg)

