Technical Analysis For Forex Trading
Develop your own trading strategy by learning the concept of technical analysis and applying it to your trade.
Topics that are going to be discussed in this article:-
- What is Technical Analysis?
- How does Technical Analysis help us to trade on Forex Trading?
- Top 7 aspects of Technical Analysis that will help you to understand how to predict the price while doing forex trading or any form of trading?
Introduction
Technical Analysis is the analysis where people identify the price movement for upcoming opportunities to trade by using historical data and prices.
Using different technical analysis tools to predict upcoming movements with the help of price action, trends identification, candlestick patterns, risk management, and so on tools that help us to trade in forex markets and make a handsome profit.
What is Technical Analysis?
Technical Analysis is the method of predicting price movement with the help of historical data and price movements for future opportunities for trading.
- Technical analysis can be applied in any kind of financial market like forex, indices, stocks, commodities, and cryptocurrencies.
- Without technical analysis, we cannot able to trade because we can't predict price movements so I can we able to take a trade.
- if you know technical analysis properly like price action, trends identification, candlestick patterns, risk management, and so on then you can make a smart move when the opportunity comes and make a good profit.
How does Technical Analysis help us to trade on Forex Trading?
By understanding the different tools of technical analysis, we can predict price movement and upcoming trend identification.
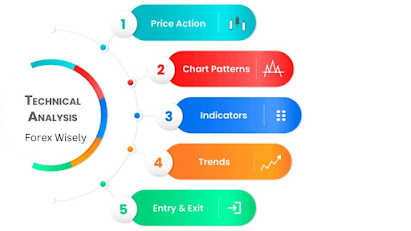
In forex trading, understanding technical analysis makes a big difference. it's all about using past data or price movement to predict future trends or movements by using different technical tools like chart patterns, candlestick patterns, indicators, and so on.
Here's how technical analysis helps us to trade;
- Identify the trends (uptrend and downtrend)
- Identify the patterns (candlestick patterns and chart patterns)
- Using different indicators (volume, moving averages, RSI, MACD)
- Managing Risk while trading (entry and exit points)
- Improve your trading strategies for better results
- using Drawing tools (horizontal and trend lines)
Top 7 aspects of Technical Analysis that will help you to understand how to predict the price while doing forex trading or any form of trading?
1. Price Action:-
Price Action is the method of analysis of the basic price movements to generate entry and exit points/signals by using some tools without using only indicators.
Actually, we can trade two ways in the forex market i.e.Price Action Trading, Indicators Trading.
- However, most of the traders preferred price action due to their simplicity and easy-to-use, and indicators are used for multi-confirmation purposes only.
- Price action trading is also called clean trading because those who trade in the forex market using the price action method only use some tools like (horizontal lines, trendlines, candlestick patterns, chart patterns, support, and resistance.) to analyze the markets/future movements.
- The price action method can be used in all kinds of markets like forex trading, cryptocurrencies, indices, stock markets, commodities, options trading, and so on.
- Price action trading is best for short-time trading (scalping, intraday, and swing trading).
Advantages of Price Action Trading
- Simplicity
- Real-time analysis
- High-probability trades can be taken using price action trading.
- Easy to use
- flexibility
- we can use it for all kinds of financial assets.
- Improved risk management and so on.
Limitations of using Price Action
- price action tools are the same but not all the trader's mindsets are the same due to behavior and thinking differences are using the same chart for different purposes some traders are buying at the support level and some are selling at the support level because of their setup are telling market will fall more so taking downside trade.
2. Trend:-
A trend is the movement of price in a single direction making highs and lows in a particular pattern over a particular amount of time.
No matter what time frame you are using;
- Uptrend can be by HH and HL.
- Downtrend can be seen by LH and LL.
Although it appears difficult to understand, it is actually not that difficult; I'll explain the idea to you using some genuine images so you can grasp it quickly.
Uptrend - higher highs (HH) and higher lows(HL)
- In Uptrend, we take trade only on pullbacks/retest level/support level.
- Take BUY trades.
- Once you predict the uptrend then you can make a handsome amount of profits.
Note:- We cannot take trade just by seeing an uptrend, we have to see other factors also to open profitable trades.
Downtrend- lower highs (LH) and lower lows (LL)
- In a Downtrend, we take trade only on the retest level/resistance level.
- Take SELL trades.
- Once you predict the downtrend then you can make a handsome amount of profits.
Note:- We cannot take trade just by seeing a Downtrend, we have to see other factors also to open profitable trades.
3. Candlestick Patterns:-
Candlestick patterns are a form of technical analysis used by traders for centuries to predict the price direction.
- candlestick patterns are the most useful tools while trading in forex markets.
- Traders analyze the shape, size, and position of candlesticks relative to each other to identify patterns and make predictions about future price movements.
- candlestick patterns help you for multi-confirmation at a particular trade.
Here are some of the candlestick patterns, that are commonly used while trading in forex;
- Marubozu
- Hammer
- Hanging Man
- Doji
- Shooting star
- Engulfing
- Harami
- Piercing
- Dark cloud
- Morning star
- Evening star
- Three white soldiers
- Three black crows
4. Chart Patterns:-
In simple words, Chart patterns is the groups of candlesticks formed a specific shapes/patterns.
- Chart patterns are the foundational building blocks of technical analysis.
- They repeat themselves in the market time and time again and are relatively easy to spot.
- Generally, swing traders/short-term traders use chart patterns to capture the whole upcoming move.
There are three types of Chart patterns.
- Reversal Chart Patterns
- Continuation Chart Patterns
- Neutral Chart Patterns
Here is the some of the commonly used Chart Patterns;
Reversal Chart Patterns
- head and shoulders
- inverted head and shoulders
- double top
- double bottom
- rounding bottom
- rounding top
Continuation Chart Patterns
- ascending triangle
- descending triangle
- rectangle pattern
- cup and handle pattern
- inverted cup and handle pattern
Neutral Chart Patterns
- rising channel
- falling channel
- rising wedge
- falling wedge
- symmetrical triangle
Note: Use the volume indicator to confirm whether the breakout is real or fake.
5. Support and Resistance:-
Support and Resistance are the concepts of technical analysis used by traders to take entry and exit the trades aiming for profit without taking a big amount of risk.
Support is a price level where the price tends to stop falling and may bounce back up.
Resistance is a price level where the price stops rising and tends to reverse its direction and start falling.
simple to understand,
- Resistance - Supply - Sellers
- Support - Demand - Buyers
Note:- While finding support and resistance, find at least 3 or more points to make or mark the touches with the help of horizontal/Trendlines.
6. Indicators:-
There are a lot of technical tools available to predict the price movement. Among these tools, one of the most commonly used is the Indicator.
Indicators play a vital role in helping traders identify potential entry and exit points, access market volatility, and confirm the strength of a trend.
Indicators are used for;
- to know momentum
- to know trends
- to know the strength of a trend
- to know reversal signals
Here are some Indicators that are commonly used for finding the trend's strength, entry and exit in forex trading are:-
- Moving Average Convergence Divergence (MACD)
- Stochastic Oscillator
- Bollinger Bands
- Relative Strength Index (RSI)
- Fibonacci Retracement
- Standard Deviation
- Ichimoku Cloud
7. Risk Management:-
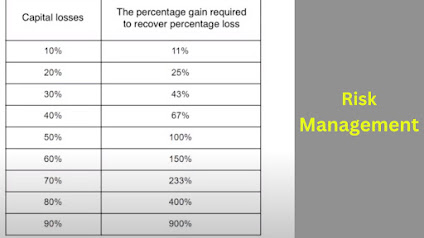
Risk Management is a process where you set up some rules to cut down big losses while trading in forex trading.
- Risk Management is the foundation of survival for all traders.
- Its aim is to manage your risk per trade while trading in forex.
- The disciplined trader says successful trading is 80% money management and 20% strategy.
Famous quote from a famous hedge fund manager Larry Hite,
I have two basic rules about winning in trading as well as in life
- "If you don't bet, you can't win.
- If you lose all your chips, you can't bet."
The bigger your loss, the more difficult it gets to recover it in the future.
Risk Management Strategies:
- Following the trend
- Plan the trade
- Decide your risk: reward ratio
- Set some rules and control your emotions while trading in the forex market
- Position sizing
- Applying strict stop-loss
- Booking Profits
Conclusion
Technical analysis is more than just a tool; it's a language that speaks volumes about the dynamics of the financial markets.
Any kind of trading, including forex trading, demands an in-depth knowledge of all the essential concepts of technical analysis that I have already discussed.
Using the data above, you should be able predict future price fluctuations.
Using the data above, you should be able predict future price fluctuations.
Tags:
FOREX TRADING


.jpg)
.jpg)
.jpg)
.jpg)
.png)
.jpg)
.jpg)
.jpg)
.jpg)
